Journey resolution
81.4%3256/4000KPI dashboard · seed 20260929
Funnel, first response, and resolution
4000 synthetic journeys and 6376 events. A journey is one customer, one intent, and one or more contacts. Digital channels are ussd, app, web, and social. The assisted channel is call.
Digital-first journeys that later reach a call
32.0%971/303501
Funnel
Each bar is a committed count divided by its own denominator. The two digital-to-call rows share a numerator and use different denominators.
Journey resolution81.4%
Resolved on the first contact55.6%
Repeat contact36.5%
Channel switch30.9%
Digital-first75.9%
Digital-to-call, all journeys24.3%
Digital-to-call, digital-first journeys32.0%
Abandoned18.6%
02
First channel to journey outcome
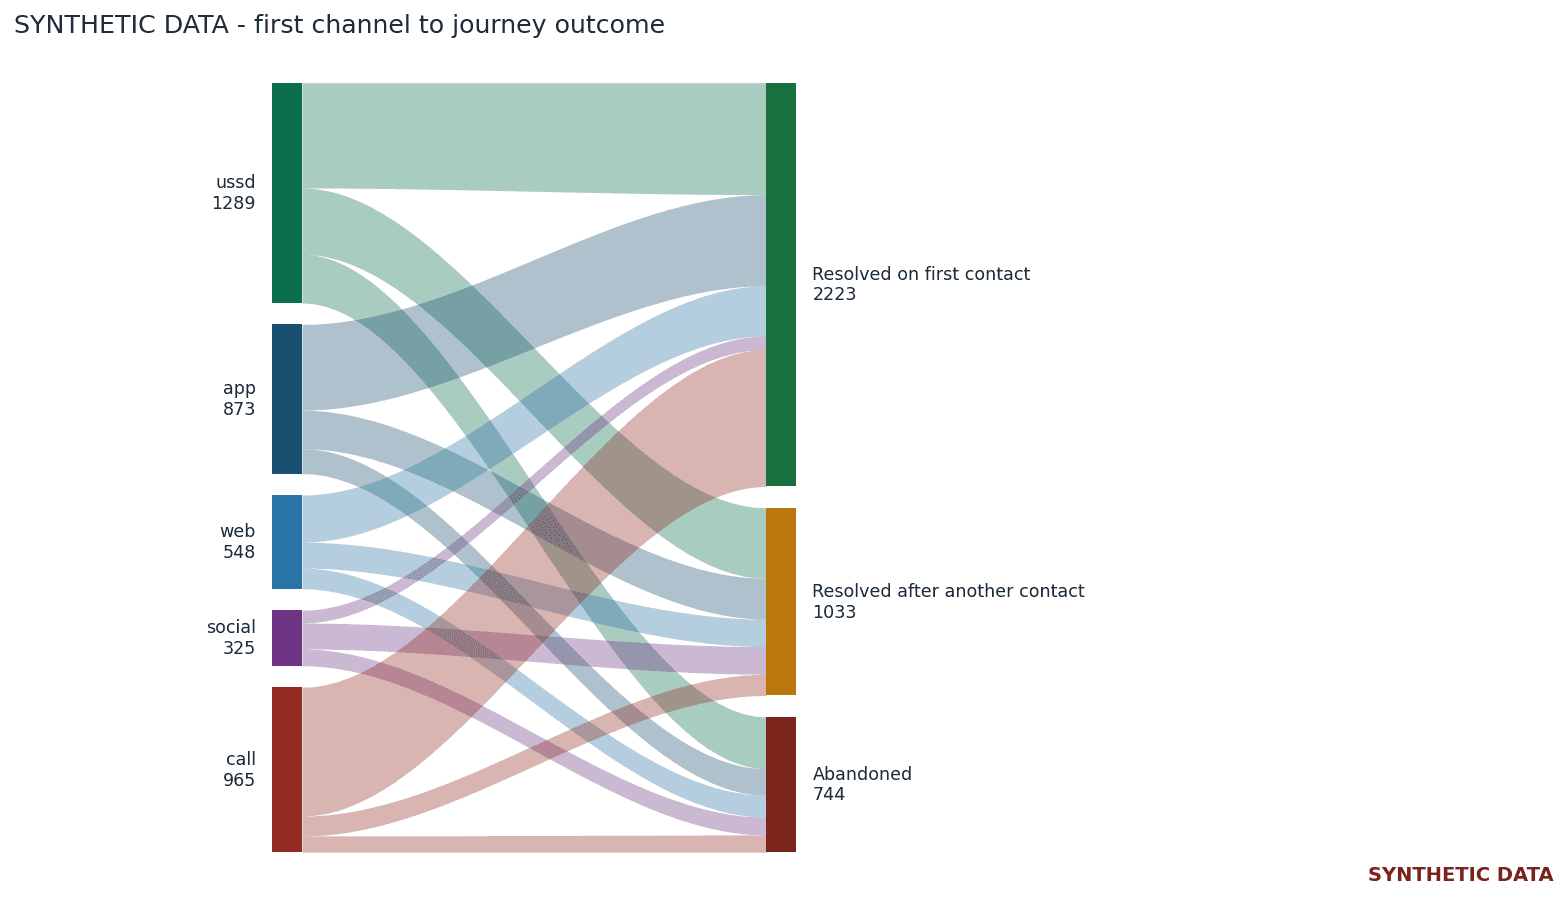
The Sankey splits the same 4000 journeys into resolved on the first contact, resolved after another contact, or abandoned.
Resolved on first contact Resolved after another contact Abandoned
ussd
n=1289
app
n=873
web
n=548
social
n=325
call
n=965
| First channel | Resolved on first contact | Resolved after another contact | Abandoned | Journeys |
|---|---|---|---|---|
| ussd | 616 | 388 | 285 | 1289 |
| app | 502 | 225 | 146 | 873 |
| web | 276 | 151 | 121 | 548 |
| social | 75 | 152 | 98 | 325 |
| call | 754 | 117 | 94 | 965 |
03
Time to first response
Delay, in minutes, between a journey's first inbound timestamp and the response on that same first contact. Every synthetic contact has a response. Median and the 90th percentile use DuckDB quantile_cont (linear), shown to one decimal as in reports/headlines.md.
Median 90th percentile
ussdn=1289
median 1.0 min · p90 1.7 min
appn=873
median 2.0 min · p90 4.0 min
webn=548
median 4.8 min · p90 10.5 min
socialn=325
median 30.0 min · p90 69.9 min
calln=965
median 5.9 min · p90 11.2 min
| First channel | Journeys | Median minutes | 90th percentile minutes |
|---|---|---|---|
| ussd | 1289 | 1.0 | 1.7 |
| app | 873 | 2.0 | 4.0 |
| web | 548 | 4.8 | 10.5 |
| social | 325 | 30.0 | 69.9 |
| call | 965 | 5.9 | 11.2 |
04
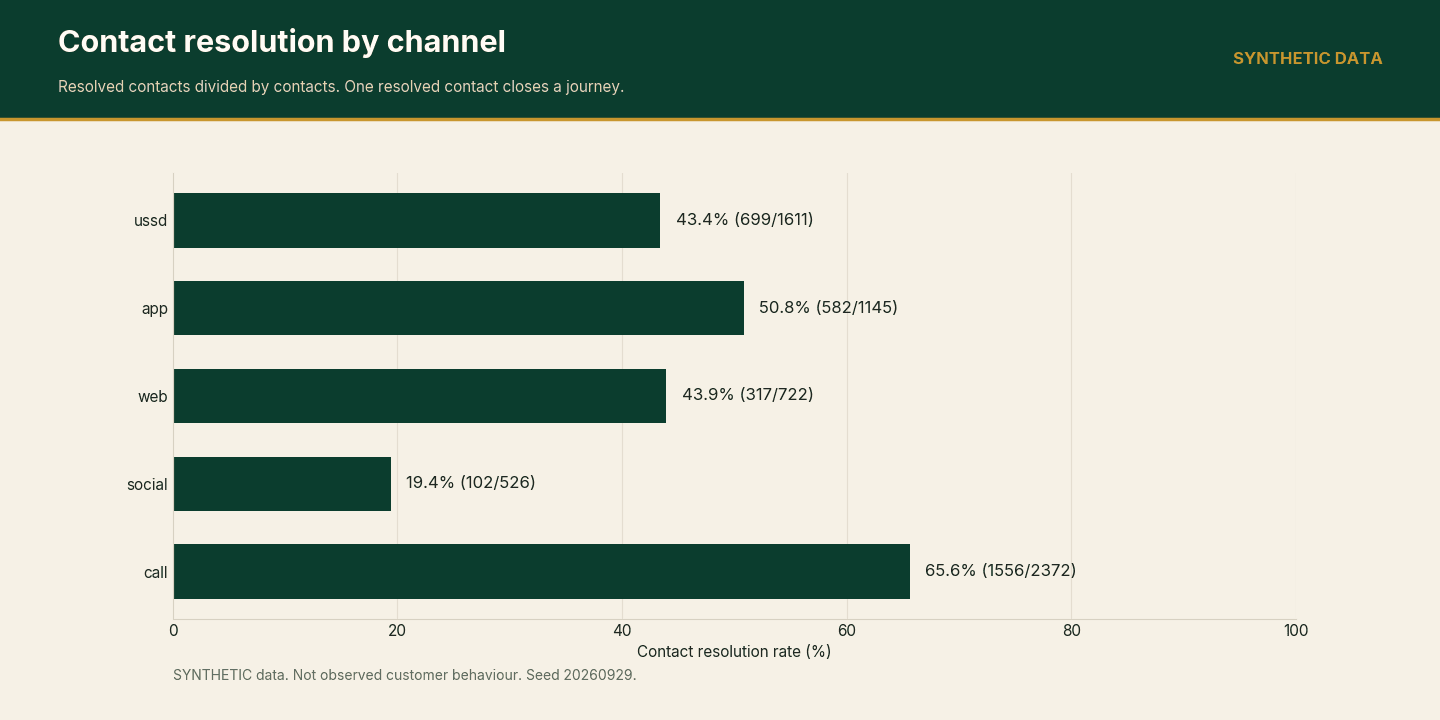
Contact resolution by channel
Resolved contacts divided by contacts on that channel. A journey has at most one resolved contact, the one that closes it.
ussd43.4%
app50.8%
web43.9%
social19.4%
call65.6%
05
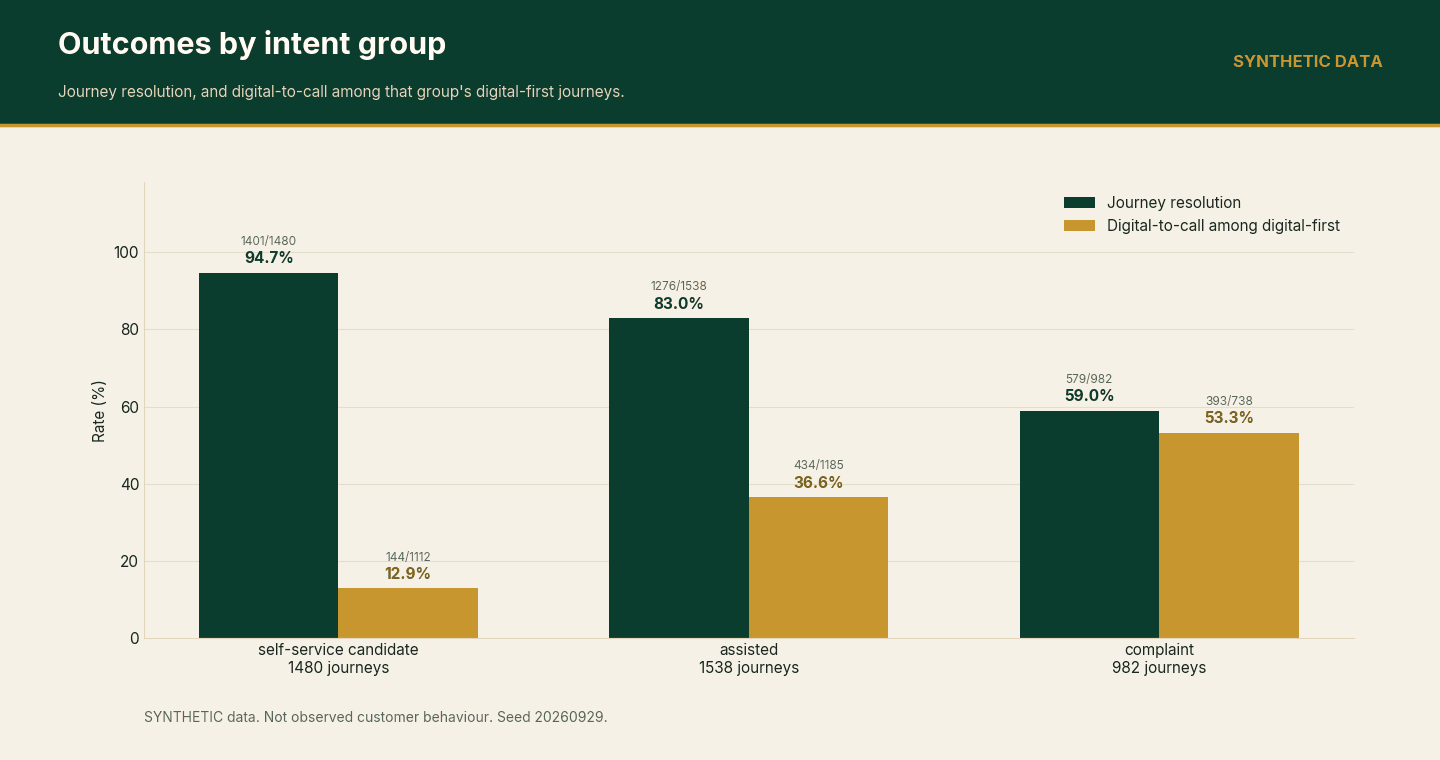
Resolution by intent
Complaint journeys move on to the call channel more often than lookup journeys. The rates below are the group totals printed in reports/headlines.md.
self-service candidate
Journey resolution94.7%
Digital-to-call among digital-first12.9%
assisted
Journey resolution83.0%
Digital-to-call among digital-first36.6%
complaint
Journey resolution59.0%
Digital-to-call among digital-first53.3%
| Intent group | Journeys | Resolved | Journey resolution | Resolved on first contact | Digital-first | Digital-to-call | Digital-to-call among digital-first |
|---|---|---|---|---|---|---|---|
| self-service candidate | 1480 | 1401 | 94.7% (1401/1480) | 1183 | 1112 | 144 | 12.9% (144/1112) |
| assisted | 1538 | 1276 | 83.0% (1276/1538) | 778 | 1185 | 434 | 36.6% (434/1185) |
| complaint | 982 | 579 | 59.0% (579/982) | 262 | 738 | 393 | 53.3% (393/738) |
Contact resolution by intent group and channel
The base probability is the config input. The realised rate is the output. Realised rates sit near the base inputs because of sampling and the two adjustments for later attempts and slow responses.
| Intent group | Channel | Config base | Contacts | Resolved contacts | Realised rate |
|---|---|---|---|---|---|
| self-service candidate | ussd | 0.82 | 540 | 420 | 77.8% (420/540) |
| self-service candidate | app | 0.86 | 351 | 300 | 85.5% (300/351) |
| self-service candidate | web | 0.74 | 212 | 160 | 75.5% (160/212) |
| self-service candidate | social | 0.30 | 139 | 48 | 34.5% (48/139) |
| self-service candidate | call | 0.90 | 554 | 473 | 85.4% (473/554) |
| assisted | ussd | 0.38 | 607 | 226 | 37.2% (226/607) |
| assisted | app | 0.52 | 464 | 227 | 48.9% (227/464) |
| assisted | web | 0.45 | 291 | 128 | 44.0% (128/291) |
| assisted | social | 0.20 | 203 | 34 | 16.7% (34/203) |
| assisted | call | 0.78 | 959 | 661 | 68.9% (661/959) |
| complaint | ussd | 0.12 | 464 | 53 | 11.4% (53/464) |
| complaint | app | 0.22 | 330 | 55 | 16.7% (55/330) |
| complaint | web | 0.18 | 219 | 29 | 13.2% (29/219) |
| complaint | social | 0.15 | 184 | 20 | 10.9% (20/184) |
| complaint | call | 0.60 | 859 | 422 | 49.1% (422/859) |
Counts by intent
reports/headlines.md prints rates for the three groups, not a rate for every intent. This table stays in counts from reports/kpis.json.
| Category | Intent | Group | Journeys | Resolved journeys | Digital-first | Digital-to-call |
|---|---|---|---|---|---|---|
| BILLING | dispute_invoice | complaint | 212 | 125 | 158 | 78 |
| BILLING | invoices | self-service candidate | 317 | 294 | 230 | 31 |
| COMPLAINTS | get_compensation | complaint | 119 | 64 | 88 | 41 |
| COMPLAINTS | report_poor_signal_coverage | complaint | 220 | 134 | 163 | 89 |
| COMPLAINTS | report_problem | complaint | 289 | 173 | 218 | 115 |
| CONSUMPTION | check_excess_data_charges | self-service candidate | 186 | 179 | 142 | 24 |
| CONSUMPTION | check_usage | self-service candidate | 467 | 448 | 347 | 42 |
| CONSUMPTION | set_usage_limits | assisted | 111 | 95 | 90 | 38 |
| CONTACT | customer_service | assisted | 150 | 117 | 115 | 36 |
| CONTACT | human_agent | complaint | 142 | 83 | 111 | 70 |
| PAYMENT | check_mobile_payments | self-service candidate | 209 | 194 | 167 | 19 |
| PAYMENT | pay | assisted | 217 | 185 | 166 | 63 |
| PAYMENT | payment_methods | self-service candidate | 91 | 87 | 68 | 8 |
| PAYMENT | schedule_payments | assisted | 131 | 109 | 108 | 42 |
| SERVICES | activate_call_management_services | assisted | 84 | 72 | 65 | 22 |
| SERVICES | activate_phone | assisted | 115 | 90 | 91 | 37 |
| SERVICES | activate_roaming | assisted | 123 | 101 | 86 | 37 |
| SERVICES | check_signal_coverage | self-service candidate | 141 | 132 | 106 | 17 |
| SERVICES | deactivate_call_management_services | assisted | 39 | 34 | 31 | 13 |
| SERVICES | deactivate_phone | assisted | 74 | 63 | 60 | 17 |
| SERVICES | install_internet | assisted | 82 | 57 | 60 | 21 |
| SUBSCRIPTION | cancel_plan | assisted | 123 | 113 | 93 | 30 |
| SUBSCRIPTION | change_plan | assisted | 164 | 130 | 127 | 44 |
| SUBSCRIPTION | change_provider | assisted | 40 | 34 | 32 | 8 |
| SUBSCRIPTION | check_cancellation_fee | self-service candidate | 69 | 67 | 52 | 3 |
| SUBSCRIPTION | sign_up_for_plan | assisted | 85 | 76 | 61 | 26 |
06
Directly-follows
Among steps that change channel, the largest flow is ussd followed by call (385). A second contact on the same channel counts as a repeat contact and does not count as a channel switch.
- call → resolved1556
- ussd → resolved699
- app → resolved582
- ussd → call385
- call → call382
| From | ussd | app | web | social | call | resolved | abandoned |
|---|---|---|---|---|---|---|---|
| ussd | 180 | 78 | 40 | 44 | 385 | 699 | 185 |
| app | 42 | 72 | 31 | 62 | 257 | 582 | 99 |
| web | 39 | 55 | 42 | 15 | 160 | 317 | 94 |
| social | 18 | 28 | 20 | 43 | 223 | 102 | 92 |
| call | 43 | 39 | 41 | 37 | 382 | 1556 | 274 |
07
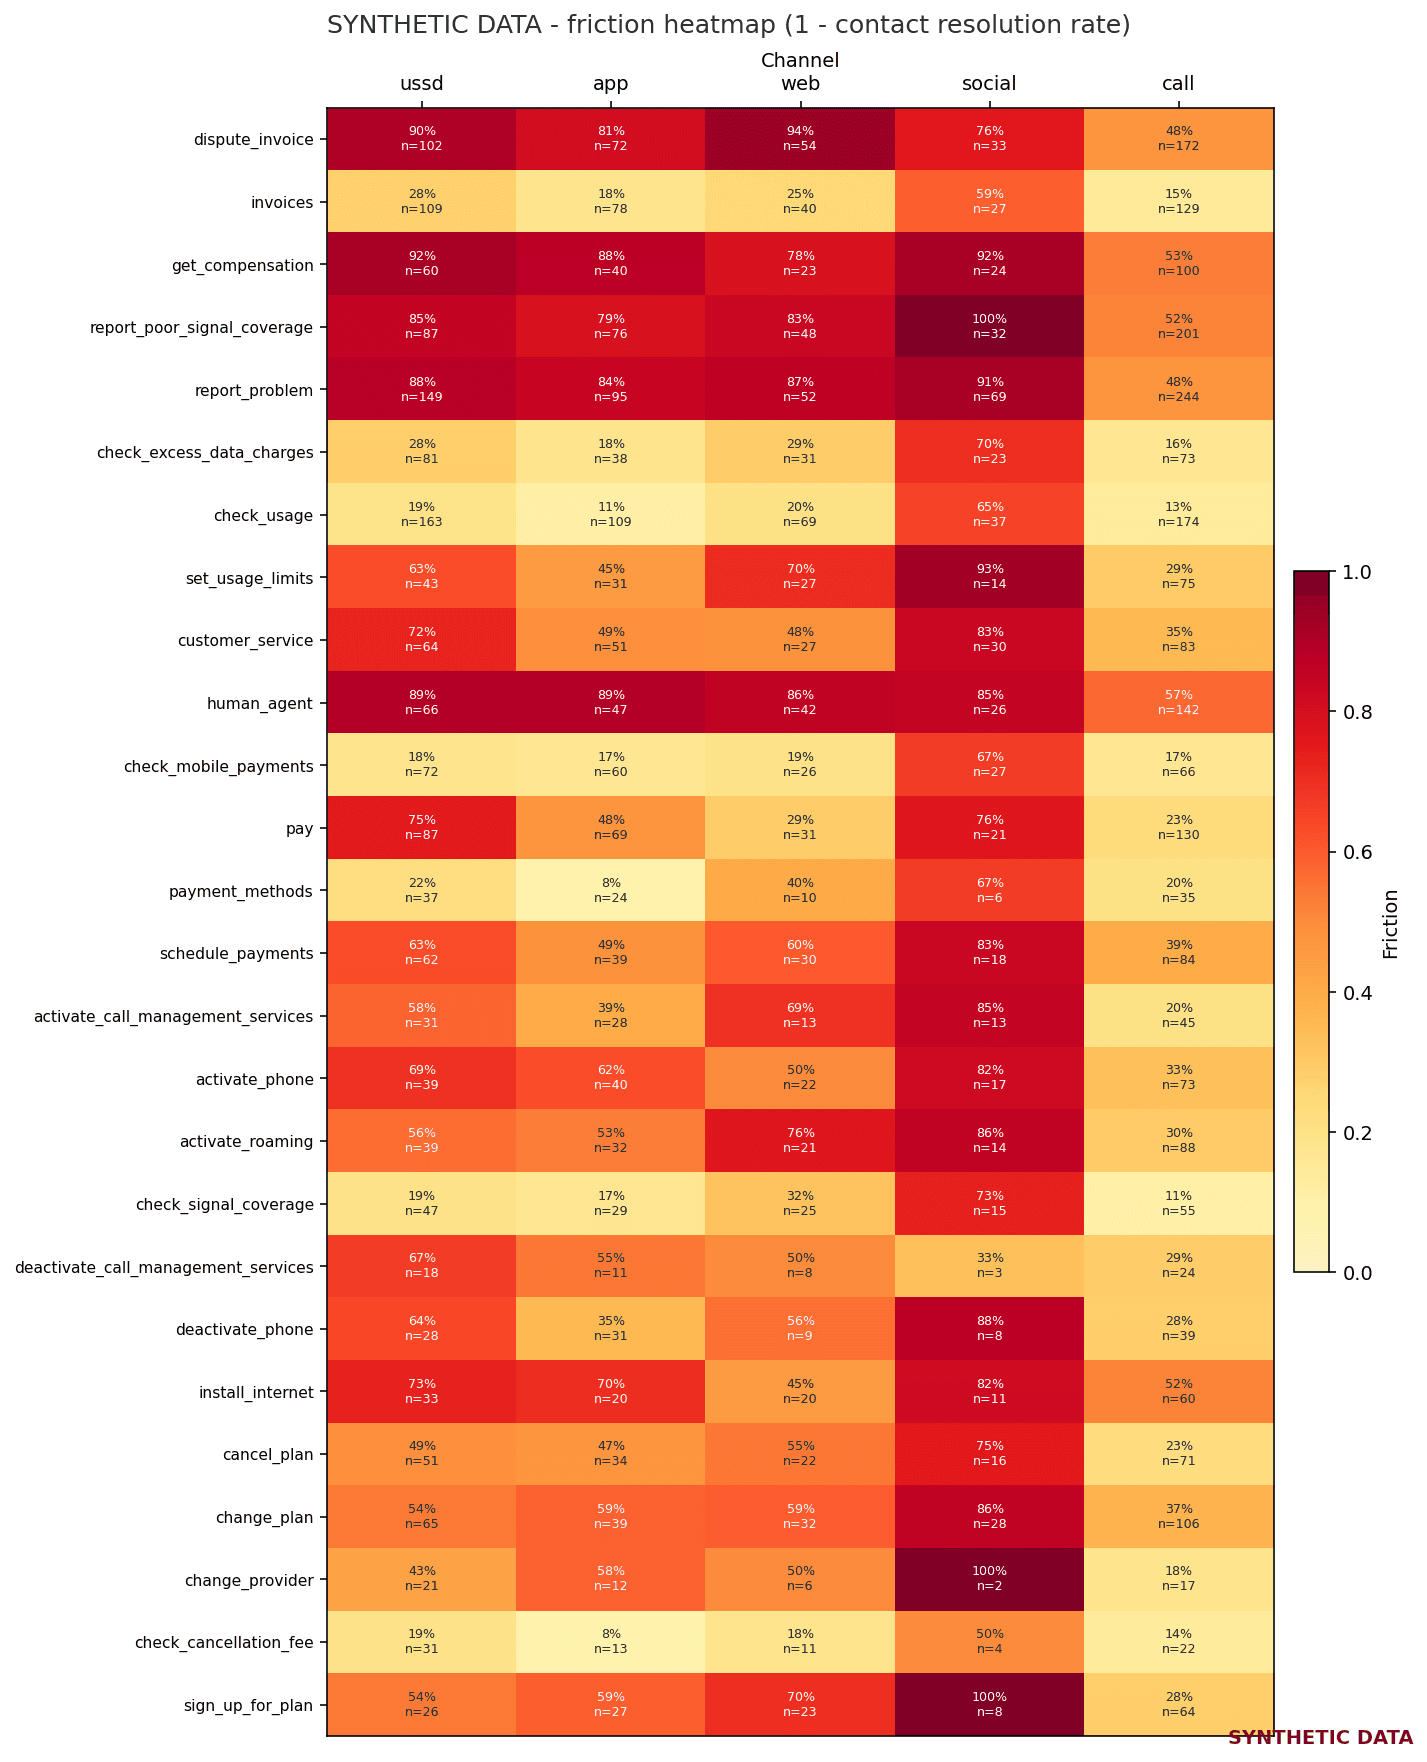
Friction heatmap
Realised friction is one minus the contact resolution rate. Cells sit near the base probabilities in the config, moved by the attempt penalty and the slow-response penalty.
08
How to read the rates
Time to first response
Time-to-first-response is the delay, in minutes, between a journey's first inbound timestamp and the response timestamp on that same first contact. Median and the 90th percentile use DuckDB quantile_cont (linear). The synthetic generator draws each delay from the channel lognormal in config/synthetic.yaml and then clips it. Every synthetic contact has a response, so there are no censored non-responses.
Repeat contact
Repeat-contact rate is the share of synthetic journeys with two or more contacts. A repeat contact is a later contact in the same journey after an unresolved contact. The synthetic log has one journey per customer, so this is not a later, separate issue from the same person.
Channel switch
Channel-switch rate is the share of synthetic journeys whose contacts use more than one distinct channel. A second contact on the same channel is a repeat contact and is not a channel switch.
Digital-to-call
A synthetic digital-to-call journey starts on a digital channel (ussd, app, web, or social) and has a later contact on the call channel. That is the operational definition of a failed digital attempt that ends in a call. The rate is reported for all journeys and again among digital-first journeys only.
Resolution rate
On the synthetic log, contact resolution rate for a channel, or for an intent group on a channel, is resolved contacts divided by contacts on that slice. A journey has at most one resolved contact, the one that closes it. Journey resolution rate is journeys whose end reason is resolved, divided by journeys. Realised rates are outputs. They are not the base probabilities in the config: each contact multiplies that base by attempt decay and, when the response is slower than the configured threshold, by the slow-response factor.
Design notes from the recommendations file
These are hypotheses for a care journey. Each one names whether it rests on the public Bitext training set or on the synthetic log. docs/recommendations.md
Lookup intents on USSD and in the app
Self-service contacts resolve at base 0.82, realised 77.8% (420/540) on ussd, and base 0.86, realised 85.5% (300/351) on the app. USSD first-contact time-to-first-response has median 1.0 minutes (n=1289). Digital-to-call in this group: 12.9% (144/1112) of its digital-first journeys.
Keep a person available for complaints
Complaint contacts resolve at base 0.12, realised 11.4% (53/464) on ussd, and base 0.60, realised 49.1% (422/859) on call. Journey resolution is 59.0% (579/982). Digital-to-call among its digital-first journeys is 53.3% (393/738).
Treat social as acknowledgement
The social clock is an input (lognormal mu 3.40). On simulated first contacts the median is 30.0 minutes and the 90th percentile is 69.9 minutes (n=325). The model multiplies resolution probability by 0.75 when a response is slower than 30.0 minutes. Lowest realised contact resolution: social, 19.4% (102/526).
Lookup intents, digital-to-call over journeys
The fraction in docs/recommendations.md divides digital-to-call by journeys for that intent. It does not use the digital-first denominator behind the 32.0% headline.
| Intent | Journeys | Digital-first | Digital-to-call | Digital-to-call / journeys |
|---|---|---|---|---|
| check_usage | 467 | 347 | 42 | 9.0% (42/467) |
| invoices | 317 | 230 | 31 | 9.8% (31/317) |
| check_excess_data_charges | 186 | 142 | 24 | 12.9% (24/186) |
| check_mobile_payments | 209 | 167 | 19 | 9.1% (19/209) |
| check_signal_coverage | 141 | 106 | 17 | 12.1% (17/141) |
| payment_methods | 91 | 68 | 8 | 8.8% (8/91) |
| check_cancellation_fee | 69 | 52 | 3 | 4.3% (3/69) |
Channels in the generator, in report order: ussd, app, web, social, call.