Journey resolution
81.4%3256/4000Omnichannel care analytics · seed 20260929
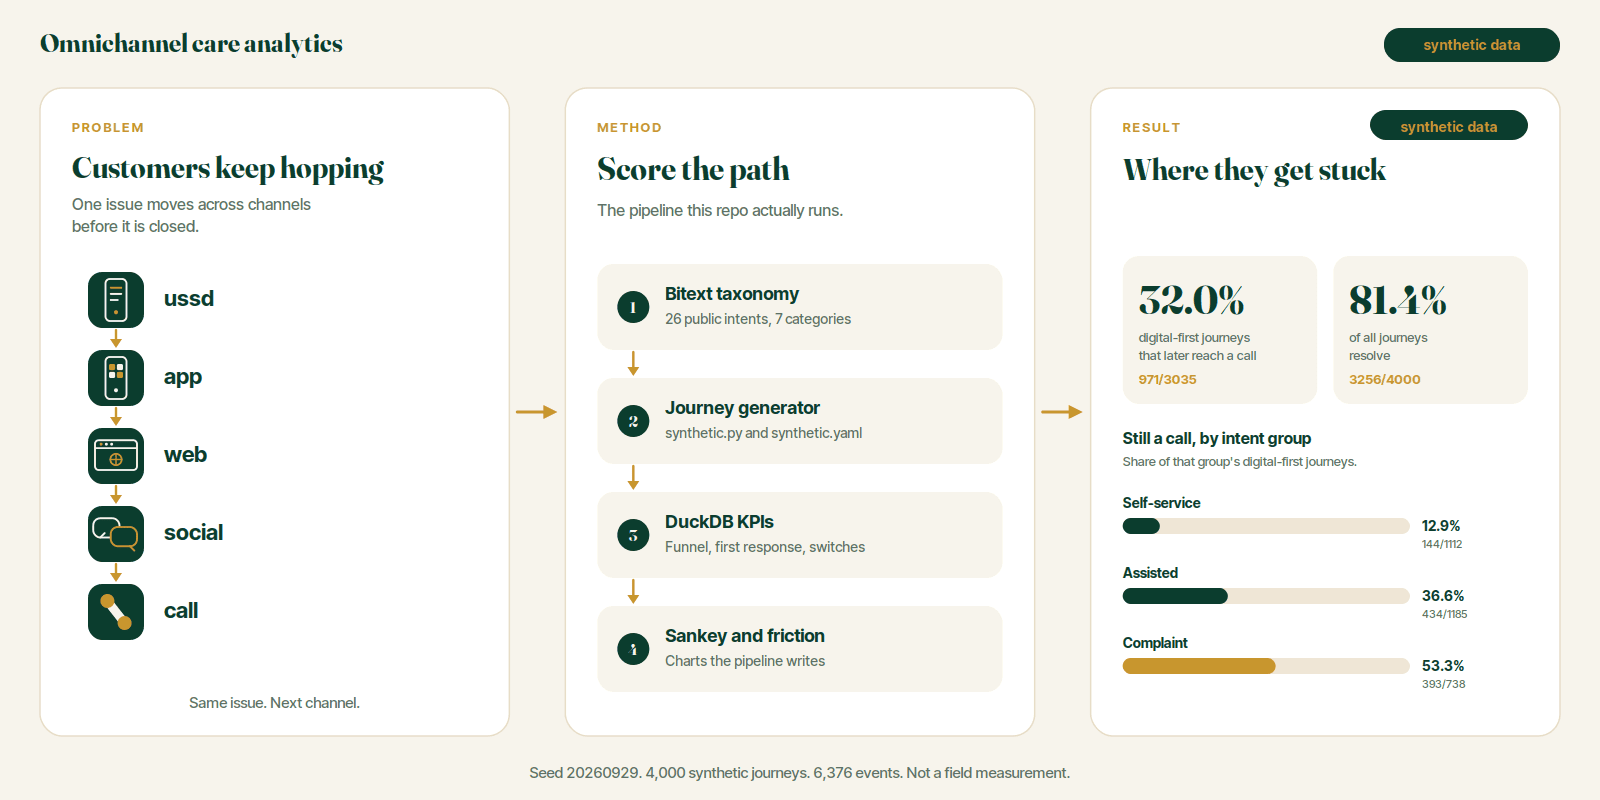
32.0%of digital-first journeys later reach a call
32.0% (971/3035). 4000 synthetic journeys, 6376 events, one journey per customer. Journey resolution is 81.4% (3256/4000).
Digital-first journeys that later reach a call
32.0%971/3035Filter those journeys by channel and intent in the live demo. This page keeps the committed totals.
Funnel
Resolution 81.4% (3256/4000). Resolved on the first contact 55.6% (2223/4000).
02Time to first response
ussd median 1.0 minutes (n=1289). social median 30.0 minutes (n=325).
03Resolution by channel and intent
call 65.6% (1556/2372). social 19.4% (102/526).
Scope
Three inputs, kept apart
Synthetic journeys
Seed 20260929. 4000 journeys. 6376 events. All journey rates on the dashboard come from this log.
Bitext training set
26000 examples, 26 intents, 7 categories, 1000 examples of each intent. Equal counts are how the file was built. They are not demand.
Twitter preview
93 data rows (49 inbound, 44 outbound). Not a telco journey study. The reply delay below is not the synthetic time-to-first-response.
Public · Bitext
Training examples by category
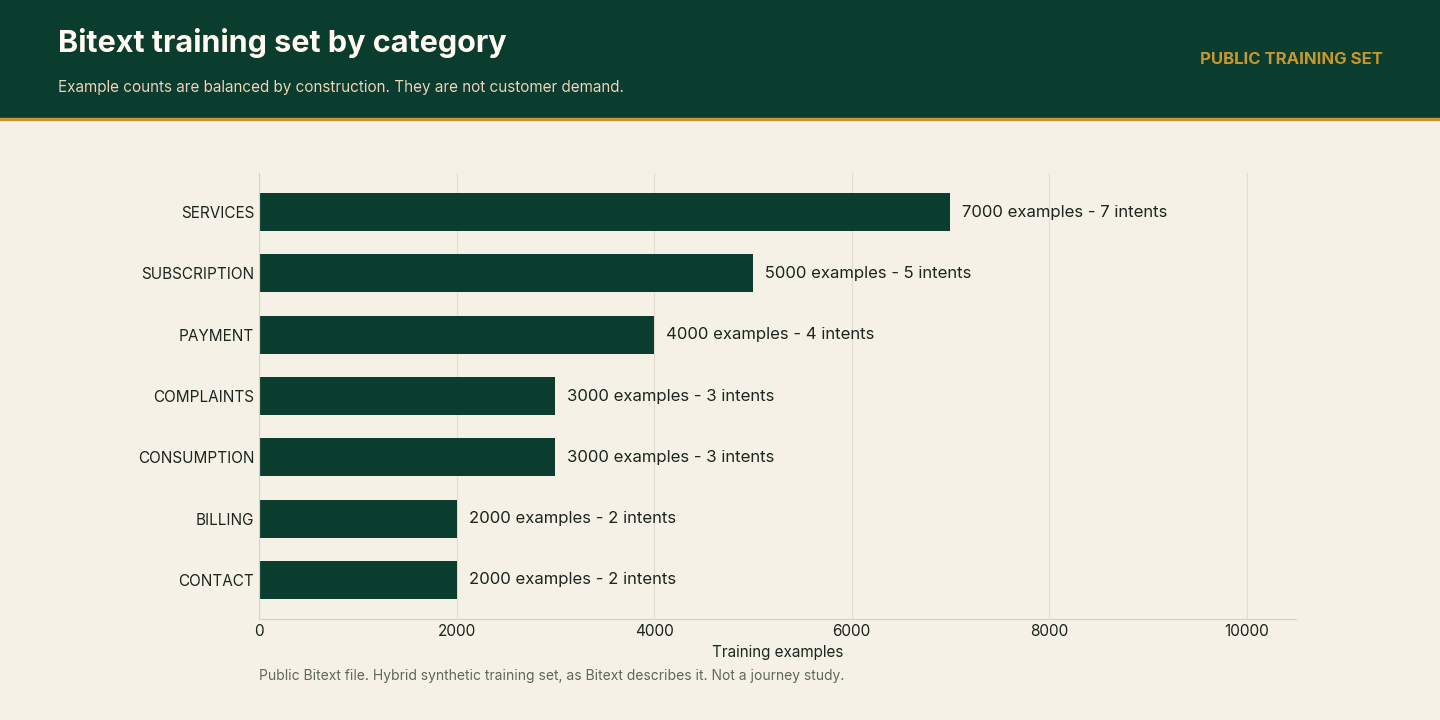
| Category | Examples | Intents |
|---|---|---|
| BILLING | 2000 | 2 |
| COMPLAINTS | 3000 | 3 |
| CONSUMPTION | 3000 | 3 |
| CONTACT | 2000 | 2 |
| PAYMENT | 4000 | 4 |
| SERVICES | 7000 | 7 |
| SUBSCRIPTION | 5000 | 5 |
Language-tag shares
Shares of the 26000 training examples. Shortest median instruction length: 42.0 characters (pay). Longest: 62.0 characters (check_excess_data_charges).
colloquial (Q)49.5%
errors and typos (Z)49.8%
offensive language (W)35.7%
interrogative structure (I)72.7%
keyword mode (K)0.0%
politeness (P)47.3%
abbreviations (E)4.7%
negation (N)0.0%
Public · Twitter preview
Not a journey sample
42 inbound-to-company reply pairs sit inside the preview. Median reply delay on those pairs: 50.8 minutes. 90th percentile: 385.7 minutes. Preview tweets from the telecom and cable-ISP allowlist, combined: 4. Do not generalise these delays.